Login
Newsroom
Contact


Combining an advanced gas extraction system with high resolution light hydrocarbon analysis from GC-MS, allows for real-time reservoir fluid characterization at surface.
Characterizing reservoir fluids requires specialized equipment for downhole formation testing. Where to test the best hydrocarbon bearing zones so as to minimize rig time?
GeoFluid provides light hydrocarbon analysis from C1-nC8 to characterize potential pay zones ahead of downhole testing. Therefore, helping to optimize downhole sampling and testing programs without further delay. Results can then be matched to PVT sample analysis.
GeoFluid is suitable for exploration, appraisal, and development projects. Use GeoFluid for offshore and onshore wells where having early reservoir fluid characterization is critical.
GEOLOG has successfully executed projects using the GeoFluid service in many countries, onshore and offshore, including USA, Tanzania, Brazil, Angola, Spain and Kurdistan with excellent track record and very positive comments from our clients.
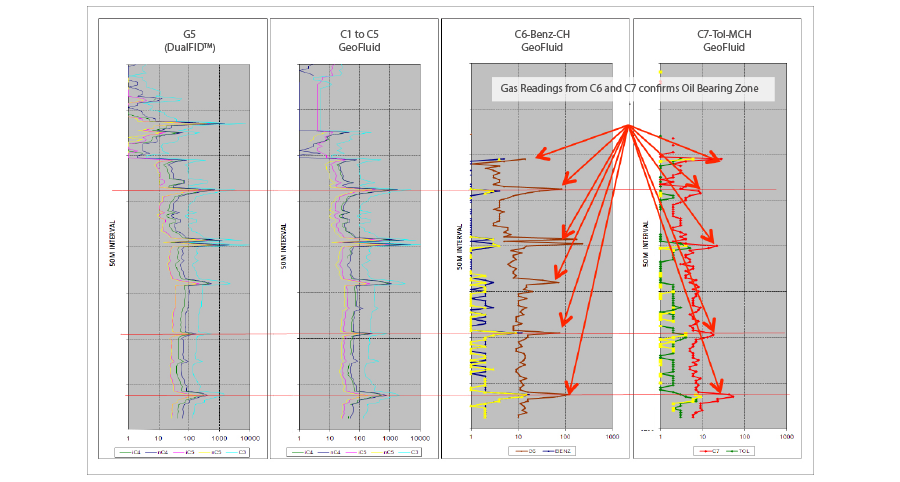
When entering the predicted pay zone, GeoFluid GC-MS identified nC6 to Toluene. This alone, was an indication of a change of formation fluid. The presence of light hydrocarbons in the C6-to C7 range provided information to the formation evaluation team to interpret the interval as an oil bearing zone.
LWD services were not available to help with the petrophysical analysis for hydrocarbon identification. GeoFluid was the default evaluation method for fluid characterization on this well. The interval identified in this example is currently producing oil, as confirmed by the initial interpretation from GEOLOG.
|
Analyzed Hydrocarbons Non Hydrocarbons |
C1 – nC8 CO2, H2S |
|
Analytical Cycle Time |
90 sec (C1-nC8) |
|
Resolution |
1 ppm |
|
Measurement Range |
1 - 100,000 ppm |