This site uses cookies, including for analytics and personalization purpose. For more information about Privacy & Cookies click here. If you continue to browse this site, you agree to this use.
Accept

Digital and Data
Management Services

Discover our services

Enhanced reservoir characterization from drill-cuttings, regional sweet spot identification & digitization of rock repositories

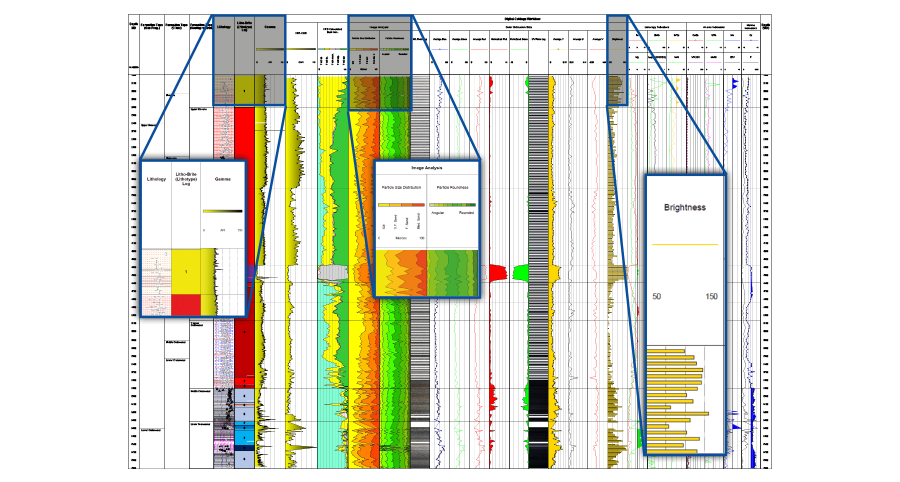
Digital-CuttingsTM (Pat. Pend.) creates a permanent high-resolution digital record of the drill-cutting rock sample, generating a rich, analytics-ready dataset that can be easily upscaled into regional and reservoir scale subsurface models, accurately calibrate rock physics models, or assist in predicting near-wellbore completion performance.  It is suitable for all cuttings or core samples, no matter the vintage, well type, bit type or mud type.

Resources
Benefits
  • High-resolution digital images in white light and UV light
  • Quantitative color extraction
  • Advanced particle segmentation for particle size and shape data, and key mineral extraction
  • Quantitative XRF major & minor elemental data
  • Seamless addition of other analytical data, e.g. XRD, TOC, Geopyrolysis or G9+ 2.0
  • Lithology interpretation
  • Detailed Litho-BriteTM (lithotype/facies) interpretation per well/(sub) basin
  • LCM identification
  • Field and lab ready data acquisition
Key Applications
  • Get ahead of the bit – sweet spot prediction from regional drill-cutting datasets
  • Upscaling into regional & reservoir scale subsurface models
  • Accurately calibrate rock physics models
  • Assist in the prediction of near wellbore completion performance
  • Ease of rich data sharing (HQ, Executive Team, Partner meetings)

.

Case History

Example 1:

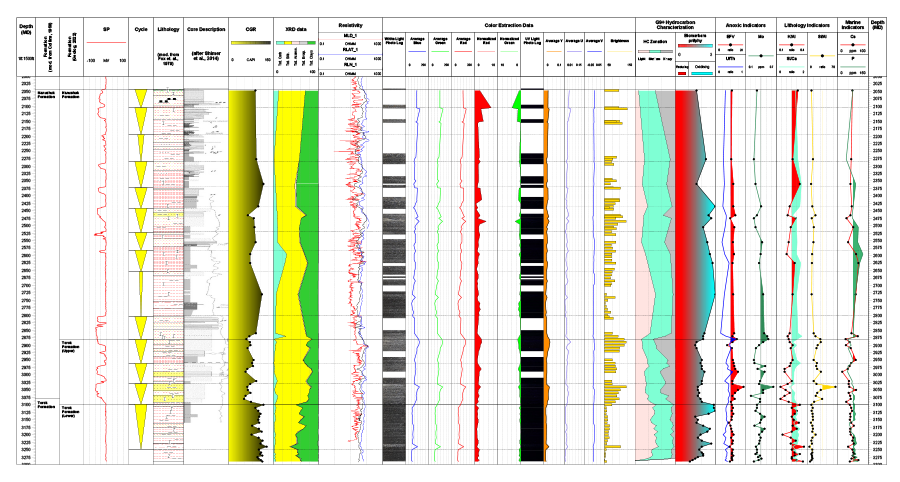
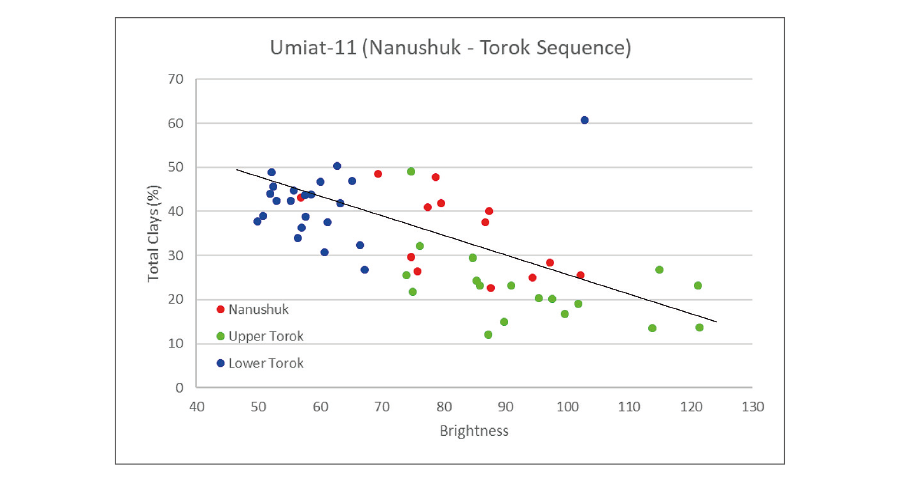
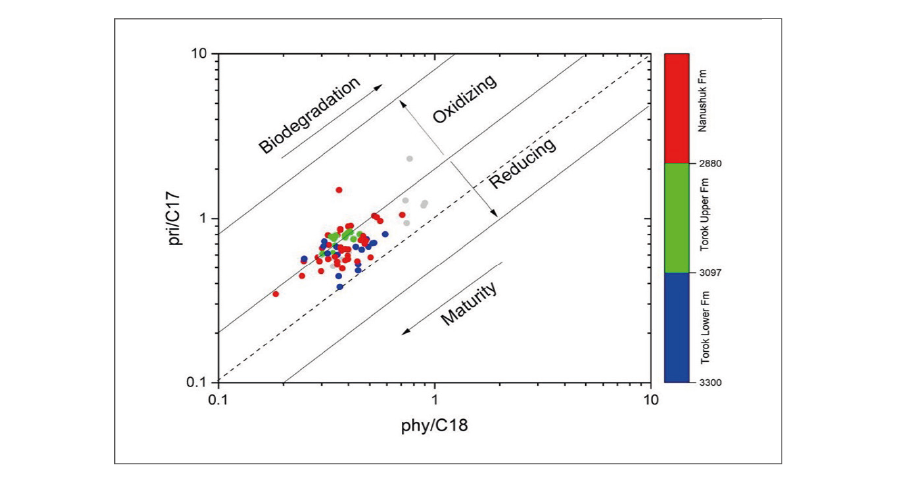
Digitalization of a major Cuttings Repository: example North Slope, Alaska

• 100’s of wells & 1000’s of cuttings samples.
• Different vintages of cuttings from the 1940s to the recent.
• Analytical consistency.
• Full digital record of every sample image, color extraction, elemental & liquid hydrocarbon quantification.


Umiat-11 well.  Full, Digital-CuttingsTM Data Summary Chart of a 1,500ft 1940’s vintage vertical well, North Slope Alaska. 
The data display includes: Tops, SP curve, Cycle interpretation, Lithology,  CGR, XRD, Resistivity, Color Extract, Brightness,
Hydrocarbon Fluid & Source Rock facies data (G9+) and elemental anoxic, lithology, and marine indicators.

Umiat-11 well, Alaska North Slope. Good correlation (-ve) between Brightness and Total Clays (%)
suggesting brighter phases (e.g. upper Torok & Torok/Nanushuk boundary) are ‘cleaner’.

Pristane/Phytane biomarker data from G9+ analyses of cuttings samples as part of a Digital-CuttingsTM workflow, Umiat-11 well Alaska North Slope. 
Note that a more reducing source rock depositional environment is indicated from the results.

Example 2:

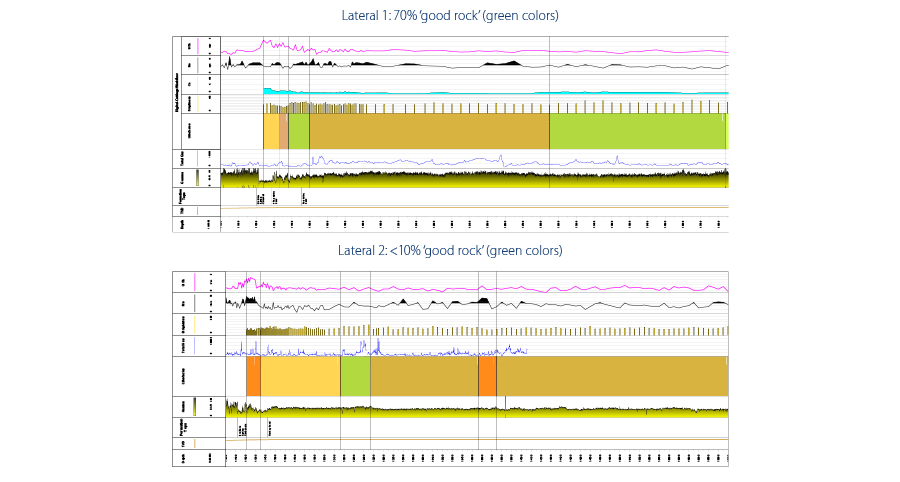
Using a Digital-CuttingsTM based approach to predict reservoir performance, Delaware Basin, New Mexico, USA

• 6 Lateral wells & >1,200 cuttings samples.
• 2 main reservoir benches.
• Litho-BriteTM framework leading to ‘good rock vs bad rock’ interpretation & facies architecture predictions.
• Strong correlation with quantitative mud-gas data.
• Lateral wells with > proportion of ‘good rock’ out-performing wells with < proportion of ‘good rock’ facies.


2 Lateral wells from the Harkey Mills Sand bench of the Bone Spring Formation, Northern Delaware Basin, New Mexico, USA. 
The black line is the top Harkey Mills Sand pick for each Lateral well.  Each plot includes MD (ft), tops, GR, Litho-BriteTM (green to brown colored zones),
Brightness & anoxia elemental indicators.  Green zones indicate channel-fill sands and relate to ‘good rock’, while brown colors indicate
overbank deposits and relate to ‘bad rock’.  When put on production Lateral 1 significantly outperformed Lateral 2, due to better completion
stage performance in the higher proportion of ‘good rock’.  Each Lateral is approx. 5,000ft in length from the top Harkey Mills Sand pick.

Example 3:

NOC requires better near-wellbore rock definition in key exploration well

• 400+ cuttings samples
• Litho-BriteTM interpretation provided a better reservoir definition
• Image analysis revealed a change in particle shape & size through the reservoir interval.
• Good correlation with flow units


Full, Digital-CuttingsTM Data Summary Chart of a 5000m vertical well, offshore GOM.  The data display includes:
Tops, Lithology, Litho-BriteTM GR, CGR, XRD, Image Analysis, Color Extract, Brightness and elemental lithology, anoxic and marine indicators.